top of page

Multi-Sub Setup for Project 2462 Sarone HiFi Listening Room

Project Overview: The multi-sub setup for Project 2462 was designed to optimize the low-frequency response of a dedicated HiFi listening room. The aim was to address room modes and standing waves that are common in small to medium-sized rooms, which can lead to uneven bass response and detract from the listening experience. By employing multiple subwoofers, we were able to achieve a smoother bass distribution and eliminate problem areas, ensuring that the sound quality remains consistent throughout the entire space.


Watch our detailed Project 2462 Multi-Subwoofer Optimization on YouTube


The first step in the multi-sub configuration is to establish the baseline acoustic profile using primary speakers and calibration tools.

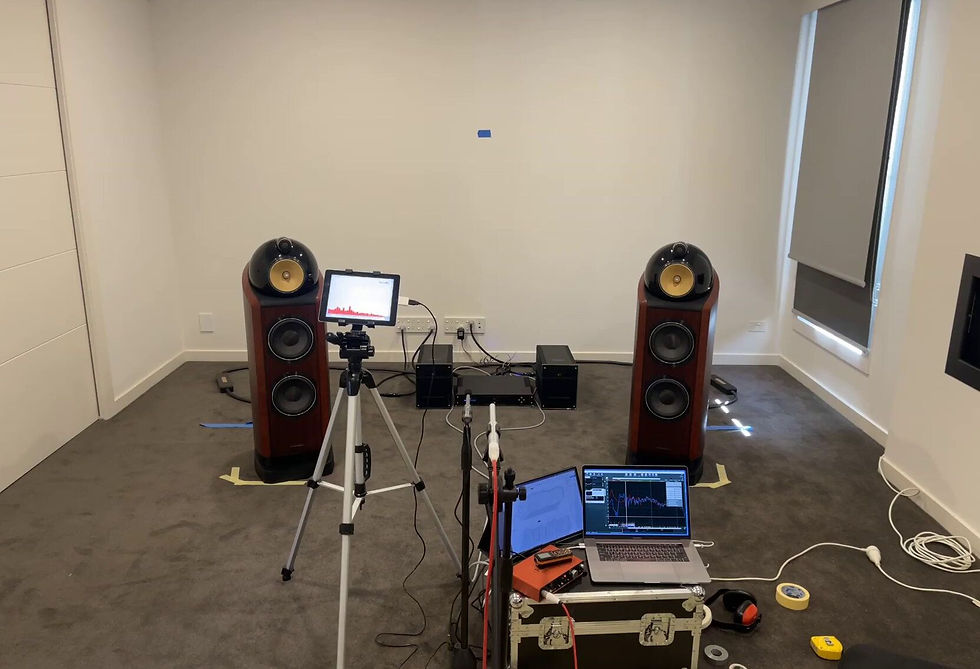
Dual microphones capture the room’s frequency response at different listening positions to analyze room modes and low-frequency decay.


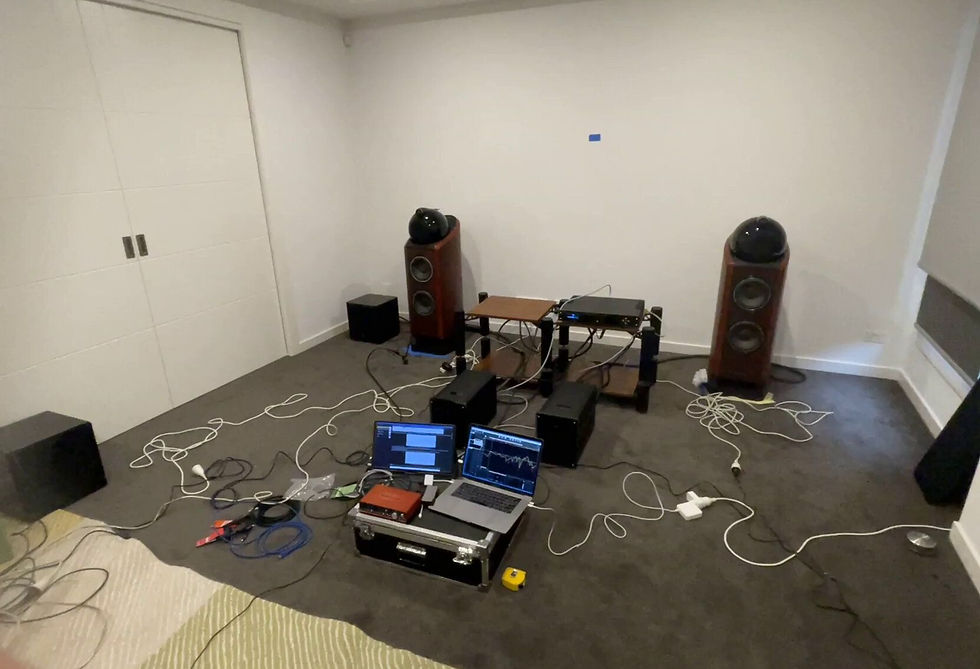
Adjusting subwoofer positions and measuring responses to identify the optimal configuration for balanced bass.

Stage 1: Initial Setup and Calibration

We started with an initial setup of the primary speakers and two additional subwoofers in order to establish a baseline measurement. The first set of images shows the room prior to any acoustic treatment, with the necessary equipment laid out for detailed analysis. This setup included multiple microphones placed strategically to capture room response at various listening positions. During this stage, we measured the room’s natural acoustic characteristics using various software, setting a reference point for further tuning.


Stage 2: Multi-Sub Optimization

The next stage focused on the positioning of multiple subwoofers to minimize the effects of standing waves. We employed CORSINI'’s multi-sub methodology, strategically placing subwoofers at various room locations to excite subtract different room modes. These techniques reduce the prominence of individual resonances and provides a more even bass response. During this process, we used iterative measurements and adjustments to balance each sub’s contribution to the overall sound.


Stage 3: Final Tuning and Listening Tests

After optimizing the multi-sub configuration, we moved to the final tuning stage, where additional adjustments were made based on subjective listening tests. These tests allowed us to identify and address any remaining issues that the measurements might have overlooked, such as low-frequency localization or a lack of impact in certain areas. Finally, we conducted post-setup measurements to ensure that all objectives were met and the sound was balanced across the entire listening area.


This graph represents the initial frequency response of the room with the client's original speaker placement. The red line indicates the measured Sound Pressure Level (SPL) across a range of frequencies from 20 Hz to 200 Hz. There is a pronounced peak around 28 Hz, highlighting a room mode issue that contributes to an excess of sub-bass energy. Additionally, there are dips and peaks between 60 Hz and 150 Hz, indicating inconsistencies in the low to mid-bass region. This baseline measurement helps identify problematic frequencies that will be addressed in the multi-subwoofer optimization stage.

This graph displays the frequency response of the room after integrating subwoofers and applying initial Parametric Equalization (PEQ) adjustments. The purple line shows the combined response of the subwoofers, while the red line represents the original frequency response for comparison. The goal here was to address the excessive sub-bass around 28 Hz and smooth out the dips and peaks seen in the 60–200 Hz range. The response is more balanced, but there are still noticeable irregularities that require further fine-tuning. This stage serves as a foundation for the subsequent optimization of subwoofer placement and PEQ settings.

This graph shows the impact of further time and phase alignment, as well as fine-tuning subwoofer positioning and additional PEQ filter adjustments. The yellow line illustrates the optimized frequency response after applying these modifications, while the red line represents the original unprocessed response for comparison. The sub-bass has been significantly leveled, and the prominent peak at 28 Hz has been controlled. Improvements in the mid-bass and upper-bass regions are evident, resulting in a more consistent and balanced low-frequency response across the 20 Hz to 250 Hz range. This stage highlights the effectiveness of combining PEQ with precise time and phase alignment.

This graph represents the final stage of the multi-sub optimization, where room correction and a custom house curve adjustment were applied. The purple line indicates the frequency response after applying a smooth house curve that enhances the sub-bass region, ensuring a fuller and more impactful low-end. The orange line shows the response prior to the house curve application. The adjustments have resulted in a smoother and more linear bass response, with the overall frequency range now exhibiting a more controlled and natural roll-off. This final tweak brings out the best tonal balance suited for the client’s HiFi listening preferences.

This final graph illustrates the comprehensive transformation achieved in the listening room through multiple stages of optimization. The red line represents the initial frequency response before any treatment or calibration, highlighting significant issues in the sub-bass and bass regions, with excessive peaks around 28Hz and uneven dips and spikes throughout the mid-bass range.

The purple line, on the other hand, shows the end result after implementing speaker placement adjustments, subwoofer optimization, time alignment, polarity correction, and the use of parametric EQ filters. Additional room correction was applied to smoothen the response, followed by the application of a custom house curve tailored to the client’s preferences.

The final response is significantly more balanced, with a smooth transition from sub-bass to bass and a controlled mid-bass region, ensuring clarity and impactful low-end reproduction.


The room now offers a much more refined and enveloping listening experience, showcasing the value of a detailed and iterative acoustic setup process.


By leveraging a multi-subwoofer approach, Project 2462 achieved a cohesive low-end response, providing deep, controlled bass without overwhelming the room. This setup ensures that the listening experience is immersive and accurate, delivering the artist’s true intention.

For more information or to schedule an acoustic consultation, visit: Corsini Acoustic Solutions.

1 view0 comments

Comments


bottom of page